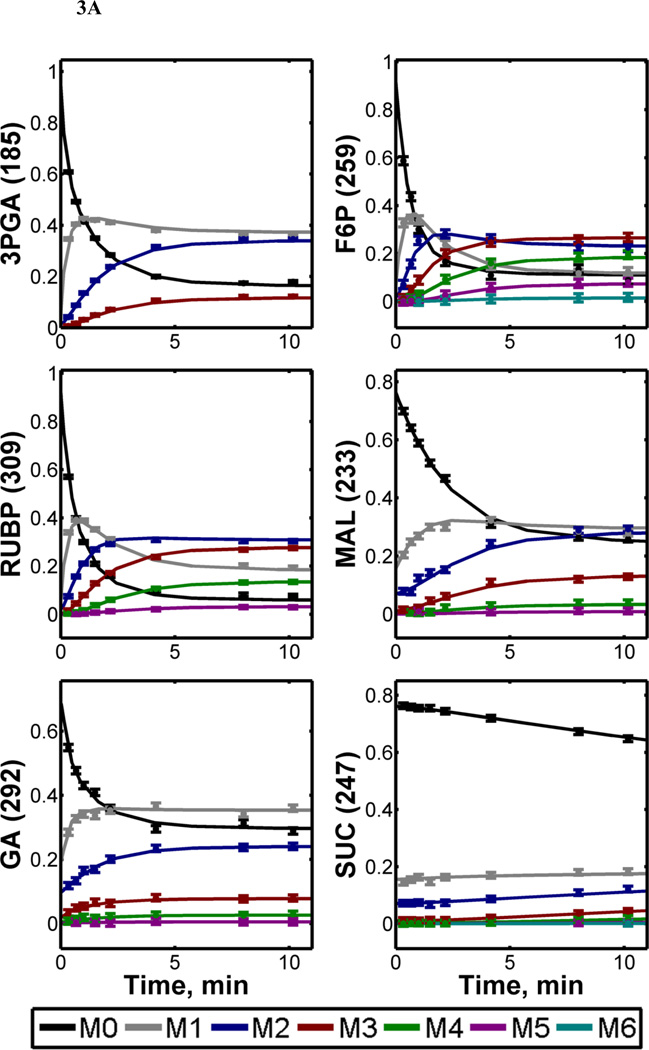
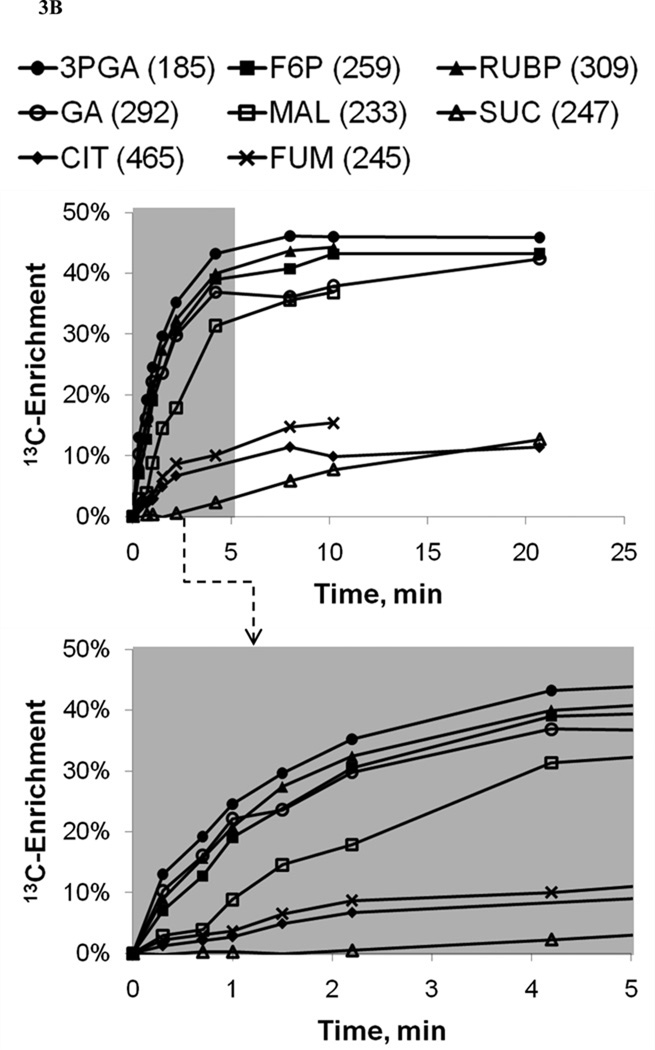
Figure 3. 13C-Labeling trajectories of selected central carbon metabolites.
(A) Experimentally measured mass isotopomer abundances (data points) and INST-MFA model fits (solid lines). Error bars represent standard measurement errors. Raw mass isotopomer data are shown without correction for natural isotope abundance. (B) Average 13C-enrichments of selected ion fragments. Mass isotopomer distributions were corrected for natural isotope abundance using the method of Fernandez et al. (1996), and average 13C enrichment was calculated using the formula , where N is the number of carbon atoms in the metabolite and Mi is the fractional abundance of the ith mass isotopomer. The top axis shows the full labeling trajectory and the bottom axis shows an enlarged view of the highlighted region from 0–5 min. Ions shown are for 3-phosphoglycerate (3PGA), fructose-6-phosphate (F6P), ribulose-1,5-bisphosphate (RUBP), malate (MAL), glycerate (GA), succinate (SUC), citrate (CIT) and fumarate (FUM). Nominal masses of M0 mass isotopomers are shown in parentheses.


