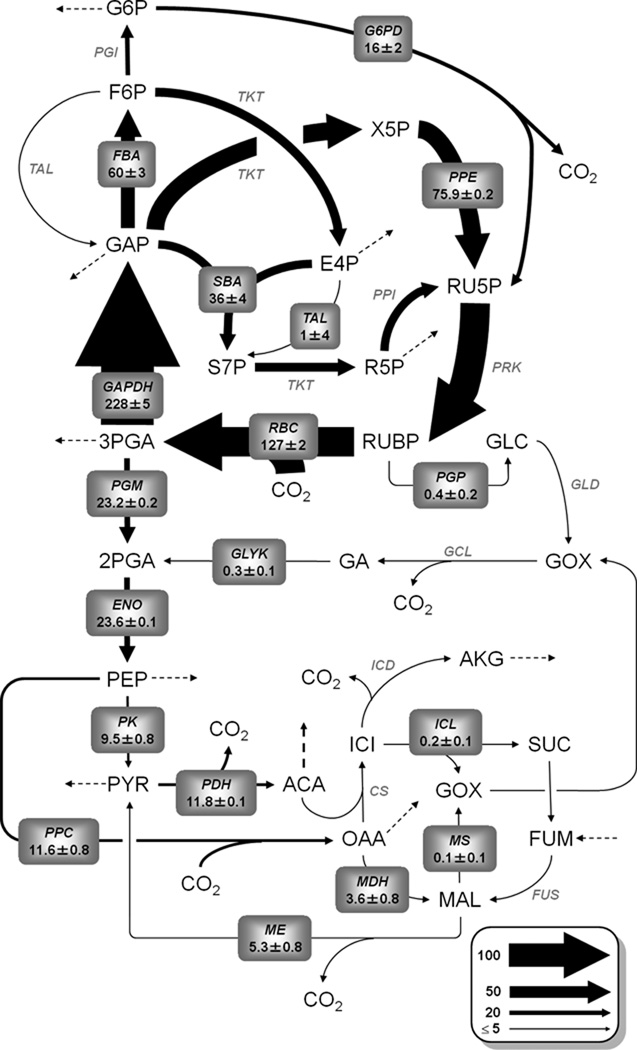
Figure 4. Synechocystis flux map determined under photoautotrophic growth conditions.
Net fluxes are shown normalized to a net CO2 uptake rate of 100. Values are represented as M ± SE, where M is the median of the 95% flux confidence interval and SE is the estimated standard error of M calculated as (UB95 – LB95)/3.92. (UB95 and LB95 are the upper and lower bounds of the 95% confidence interval, respectively.) Arrow thickness is scaled proportional to net flux. Dotted arrows indicate fluxes to biomass formation.

