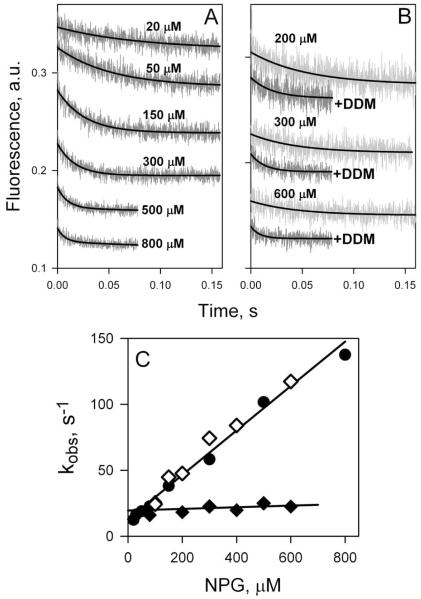
Figure 8.
Sugar binding rates measured as Trp151→NPG FRET with WT LacY reconstituted into proteoliposomes or solubilized in DDM. (A) Stopped-flow traces of changes in Trp fluorescence recorded after mixing of LacY in DDM with given concentrations of NPG. (B) Stopped-flow traces showing NPG binding to LacY reconstituted into proteoliposomes (light grey traces at 3 sugar concentrations), and after dissolving of proteoliposomes in 0.3% DDM (dark grey traces). (C) Concentration dependence of sugar binding rates (kobs) estimated from single-exponential fits shown in panels A and B. Data are obtained with LacY in DDM solution (●), reconstituted into proteoliposomes (◆), and after addition of DDM to proteoliposomes (◇). For protein in DDM data are fitted with linear equation (kobs□=koff + kon [NPG]) with estimated kinetic parameters koff = 13 s−1; kon = 0.2 μM−1 s−1; Kd = 65 μM. Reconstituted into proteoliposomes LacY binds NPG with kobs = 21 ± 4 s−1.

