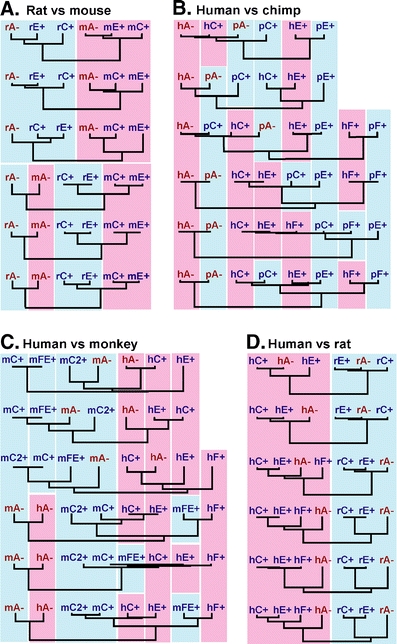
Fig. 3.

Exonwise comparisons of rodent and primate KLRC nucleotide sequences. a Mouse (m) versus rat (r), b human (h) versus chimpanzee (p), c human versus rhesus monkey (m), d human (h) versus rat (r). A, C, E, and F refer to NKG2 family member names. Presumed or proven inhibitory receptors (with ITIMs) shown in red and with minus sign; receptors without ITIMs are in blue and with plus sign. Background colors indicate species. Exon 1 at the bottom and exon 6 at the top. The lengths of the vertical lines are proportional to nucleotide differences
