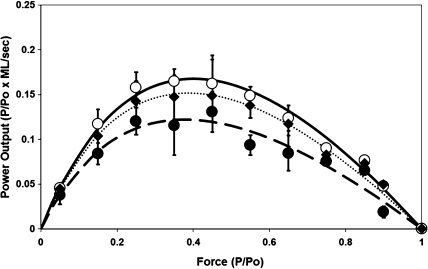
Figure 2.
Force–power curve constructed from force–velocity data. In each myocyte at each load, force values (expressed as P/Po) were multiplied times mean velocity values (expressed ML/s) to result in a value of power output for that load. Data points are means ± SD for all cells at that age. • and dashed line = 33 months old; ♦ and dotted line = 24 months old; ○ and solid line = 9 months old. Lines are the best-fit regression line using the Hill equation as in Methods. Peak power output was taken from the highest point in the best-fit line.

