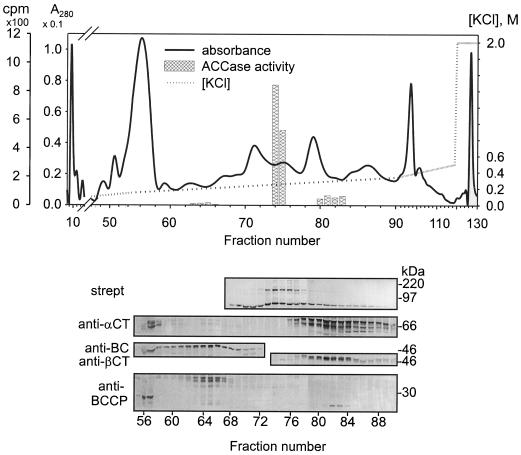
Figure 11.
Anion-exchange chromatography (Q-Sepharose column) of a soybean seed extract. After loading, the column was washed with buffer A (see Methods) at 0.5 mL/min, and then a KCl gradient (0–0.5 m) was applied. Final wash was with 2 m KCl. Fractions of 2 mL were collected, desalted, and concentrated with Microcon-10 concentrators. Proteins were separated on 9% SDS-PAGE, transferred to PVDF membranes, and probed with antibodies as indicated. strept, Streptavidin-alkaline phosphatase conjugate. The central part of the chromatographic profile is expanded to align with the lanes on the protein-blot panels. The positions of electrophoretic protein molecular-mass markers are shown at the right side of the panels for the protein blots.

