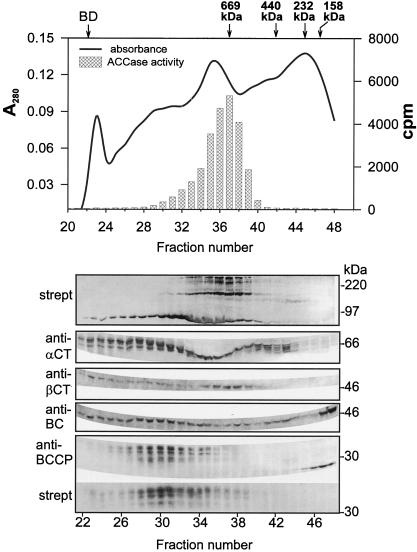
Figure 9.
Separation of soybean seed protein extract by gel filtration on Sephacryl S400. The column was eluted with buffer A (see Methods) at 0.05 mL/min. Fractions (0.75 mL) were collected, and a high-molecular-mass gel-filtration calibration kit (Pharmacia) was used to calibrate the column. Eluted protein fractions were separated on SDS-PAGE, blotted to nylon membranes, and analyzed with different antibodies as indicated. strept, Streptavidin-alkaline phosphatase conjugate. The results from the protein-gel blot are aligned with the chromatographic profile. Approximate positions of electrophoretic molecular-mass markers are shown at the right of the protein-blot panels. The position of Blue Dextran 2000 (BD) and other markers used to calibrate the column are shown above the elution profile. The markers were thryoglobulin (667 kD), ferritin (440 kD), catalase (232 kD), and aldolase (158 kD).

