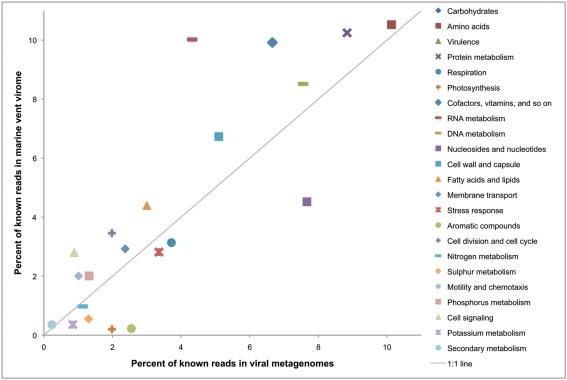
Figure 5.
Relative percentages of reads matching gene categories in the marine vent virome and a set of 42 viral metagenomes isolated from other environments (listed in Dinsdale et al., 2008). The solid line indicates a 1:1 ratio between the vent metagenome and the other viral metagenomes. Metagenomes were analyzed with MG-RAST (Meyer et al., 2008) and annotated using the SEED subsystems database.

