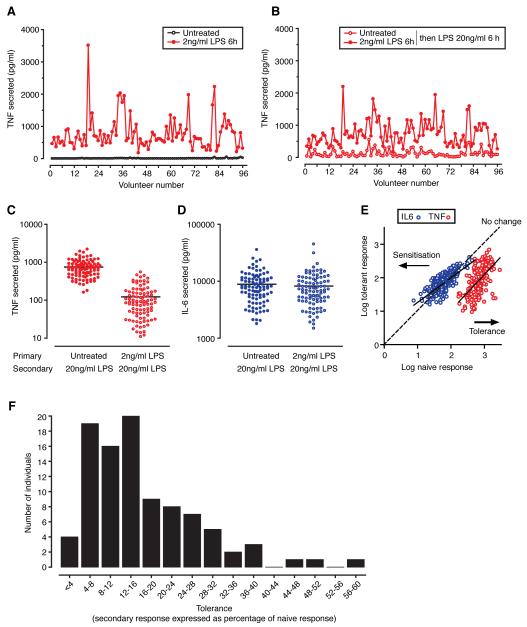
Figure 1. LPS induced TNF release among 96 healthy volunteers.
A, TNF levels in culture supernatant for untreated and treated PBMCs (2ng/ml LPS for 6 h) or B, comparing response to 20ng/ml LPS for 6 h between naïve cells and cells pretreated with LPS 2ng/ml for 6 h. C, Scatter plot for all volunteers showing TNF secretion and D, IL-6 secretion. E, Comparison of TNF and IL6 naïve vs tolerant response. F, Frequency distribution of tolerance across the cohort.

