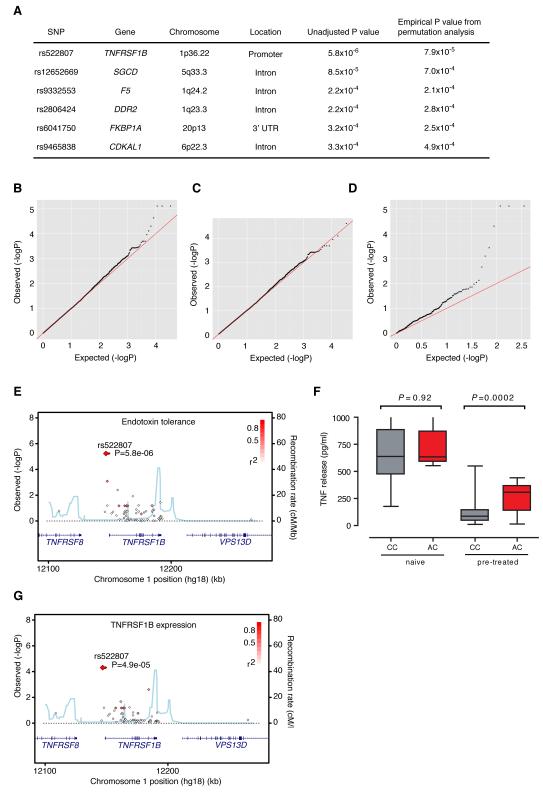
Figure 2. Expression quantitative trait mapping of endotoxin tolerance.
A, Top SNP associations with endotoxin tolerance. Quantile-quantile plots considering all genotyped SNPs (B), SNPs excluding those involving all TNF/TRAF genes (C), or including only those SNPs relating to TNF/TRAF genes (D). E, Regional association plot for endotoxin tolerance. F, Allelic association for rs522807 with TNF release following LPS 20 ng/ml for 6h, with and without LPS 2 ng/ml pretreatment for 6h. G, Regional association plot for TNFR2 expression.

