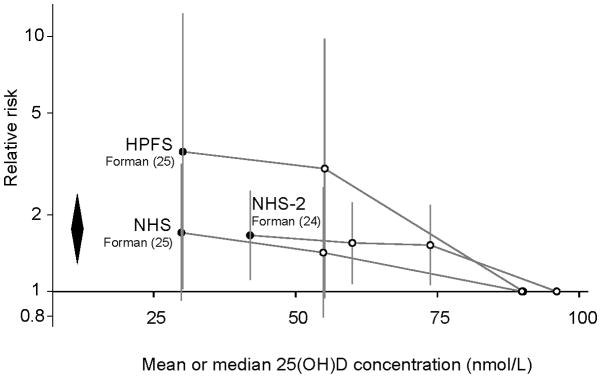
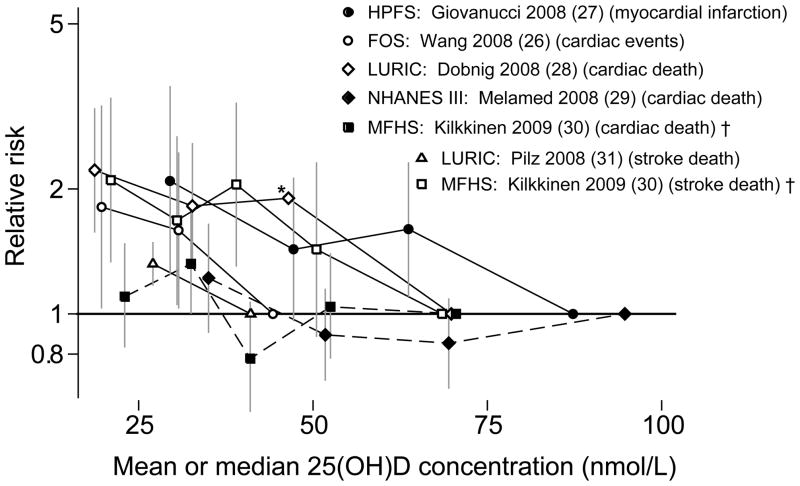
Figure 1.
Association between vitamin D status and incident hypertension (Figure 1A) and cardiovascular disease (Figure 1B) in longitudinal observational cohorts.
25(OH)D, 25-hydroxyvitamin D; FOS, Framingham Follow-up Study; HPFS, Health Professionals Follow-up Study; LURIC, Ludwigshafen Risk and Cardiovascular Health; MFHS, Mini-Finland Health Survey; NHANES III, Third National Health and Nutrition Examination Survey; NHS, Nurses Health Study; NHS-2, Nurses Health Study-2.
To convert 25(OH)D concentration from nmol/L to ng/mL divide by 2.459.
Relative risks (and 95% confidence intervals) of each quantile of 25(OH)D concentration compared to the highest concentration quantile for studies with incident hypertension (1A) and cardiovascular events (1B) outcomes. In figure 1A, the diamond represents the meta-analysis summary relative risk and 95% confidence interval for the lowest quantiles (black circles) compared to the highest quantiles (on the reference line); Relative risk=1.76; 95% CI 1.27, 2.44; I2=0%. Figure 1B does not include data from Marniemi et al. (32) because the quantiles were not defined. Solid lines in Figure 1B indicate that trends were statistically significant; dashed lines that trends were not statistically significant.
* Estimate from reported data; no confidence interval data available.
† To make studies graphically comparable, data were converted to provide estimates of relative risks if the lowest quintile were the reference group. The original study (Kilkkinen et al. (30)) used the highest quintile as the reference group.


