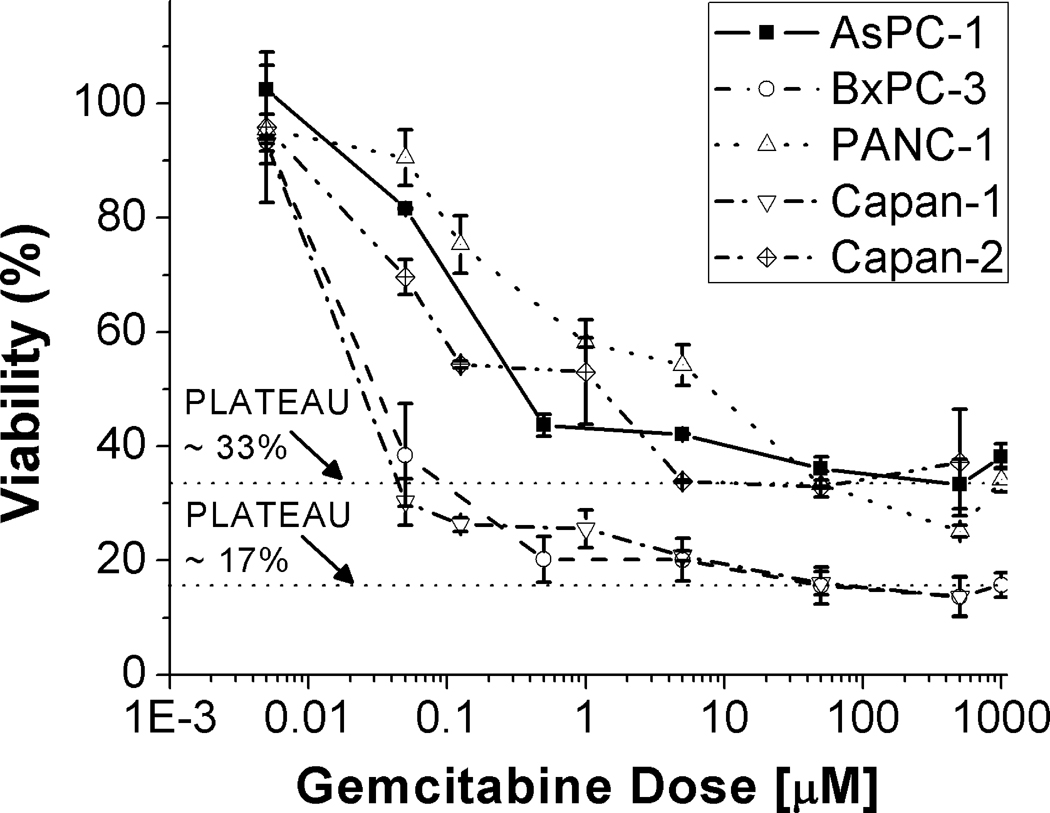
Figure 3.
Gemcitabine dose response curves. Percentage viability is plotted against a nearly 6 order of magnitude range gemcitabine dose where in each case the indicated concentration was incubated for 72 hours. The results indicate that in each case there is an initial response at sub micromolar doses, while non-responsive sub-populations of each cell type persist even to millimolar concentrations of the drug as evidence by the extended plateaus in each dose response curve. Horizontal dashed lines are included to guide the eye indicating an approximately 33% gemcitabine non-responsive fraction of AsPC-1, Capan-2 and PANC-1 cells and 17% non-responsive fraction of Capan-1 and BxPC-3 cells.

