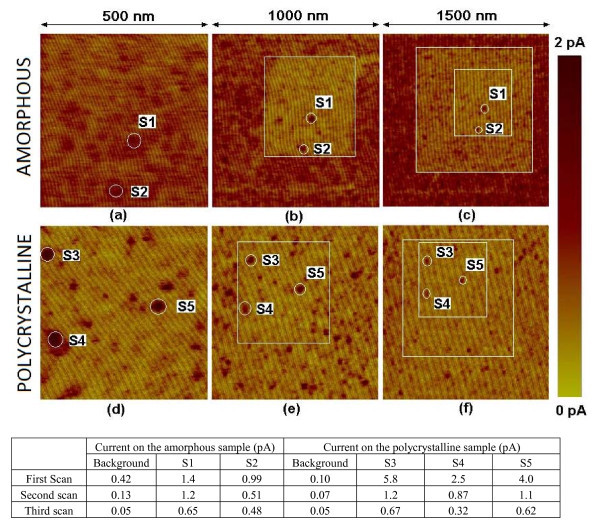
Figure 3.
First scans (a, b) and two consecutive zooms out (b/e, c/f) on amorphous (a, b, c) and polycrystalline (d, e, f) samples. Their sizes are (a, d) 500 nm × 500 nm (b, e) 1 μm × 1 μm and (c, f) 1.5 μm × 1.5 μm. The applied voltage was 11.5 V in all cases. The table shows the evolution of the maximum current driven by the spots S1-S5 and on background areas for both samples.

