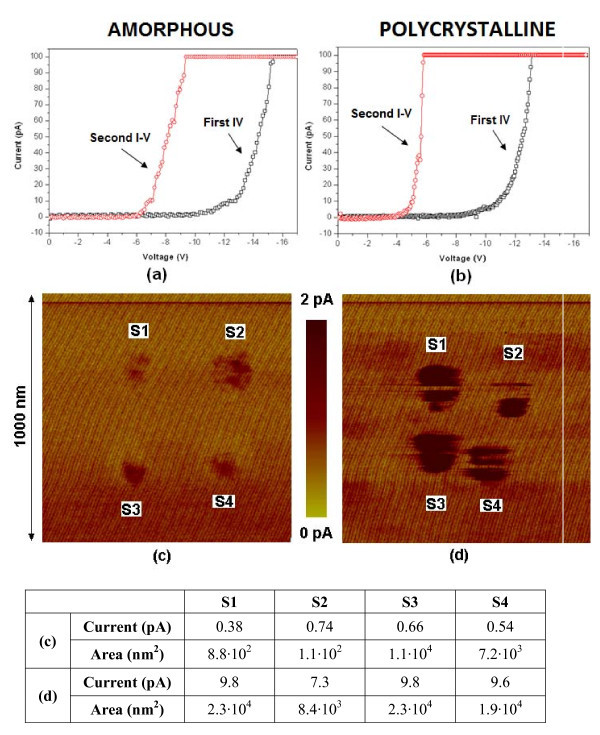
Figure 4.
Current images obtained on an amorphous (c) and polycrystalline (d) sample where previously, four RVS where applied to induce BD. The voltage applied during the scan was, in both cases, -8.6 V. (a, b) correspond to typical I-V curves measured on those positions. The maximum current and area of the BD spots can be found in the table.

