Figure 5.

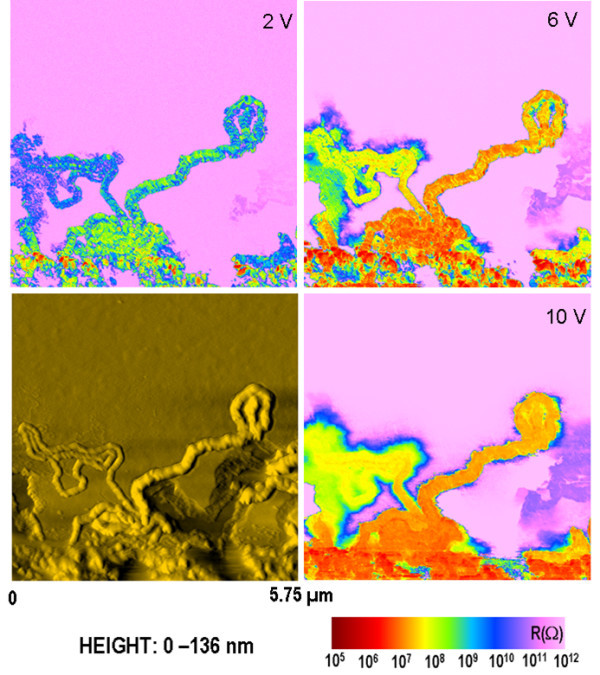
Topography and local resistance maps depicting horizontal SiNWs randomly oriented. The electrical measurements were done at different applied biases: 2, 6, and 10 V.

Topography and local resistance maps depicting horizontal SiNWs randomly oriented. The electrical measurements were done at different applied biases: 2, 6, and 10 V.