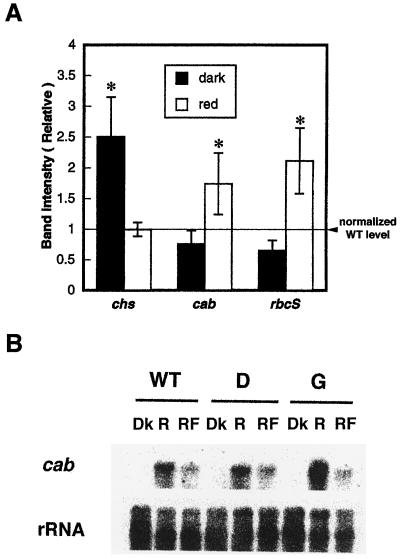
Figure 6.
Effect of red light on cab, chs, and rbcS gene expression in wild-type and antisense lines. A, Quantitation and normalization of cab, chs, and rbcS gene-expression levels. Density of the bands was measured using NIH Image software and normalized to the intensity of rRNA bands. The expression ratio of each transformant line was calculated with reference to the band intensity of the wild type for each light condition after normalizing for differences in RNA loading, and the mean value of the band intensity of transformants was then calculated. The dotted line shows the value of the wild-type control (1) for dark and red-light treatments. Asterisks indicate that the mean value of gene expression is statistically different (P < 0.05) from that of the wild-type control. B, Red/far-red-light reversibility test of cab expression in the wild type and in the transformants. Five-day-old dark-grown seedlings were frozen at time 0 in the dark (Dk) or were treated with 5 min of red light (R) (1 μmol m−2 s−1) or 5 min of red light plus 1 min of far-red light (RF) (7 μmol m−2 s−1) at time 0 and returned to the dark. After 4 h light-treated seedlings were harvested and transferred to liquid N2 in the dark. The two durations of red light given (15 and 5 min) were both above the level needed to fully induce the response (Karlin-Neumann et al., 1988).

