
Figure 5.
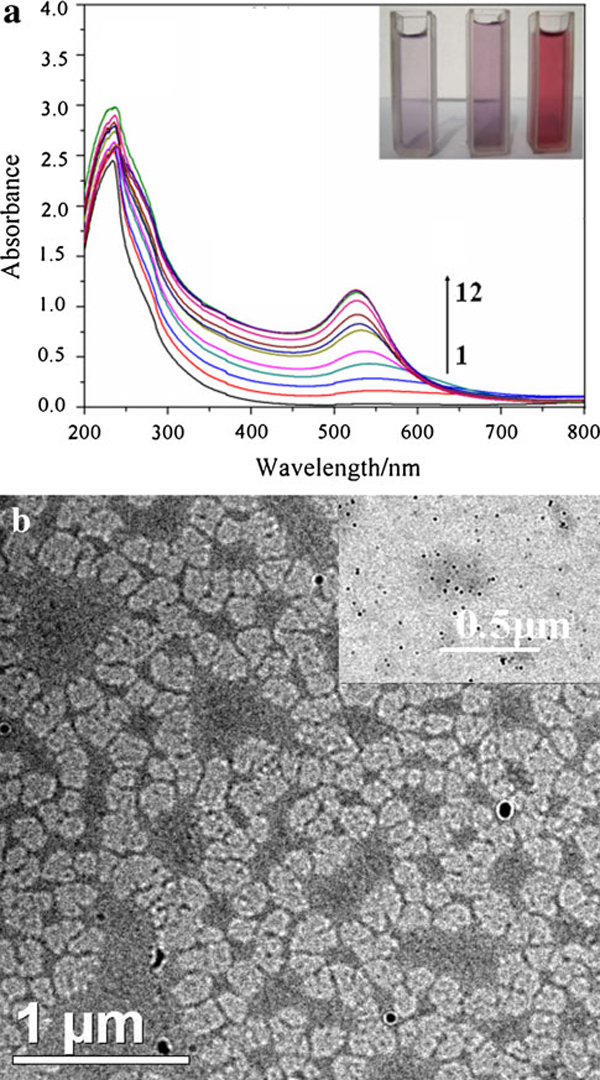
a Time evolution of the UV–vis spectra of gelatin-AuNPs synthesized at 80°C (Cgelatin: 0.4 wt%). The time intervals are (1) 10 min, (2) 20 min, (3) 40 min, (4) 60 min, (5) 80 min, (6) 100 min, (7) 120 min, (8) 140 min, (9) 160 min, (10) 180 min, (11) 240 min, (12) 360 min. The inset in a is digital images of gelatin-AuNPs (from left to right) corresponding to the curve 2, 3, 10, respectively; b TEM images of gelatin-AuNPs (curve 3), the inset in b is the TEM image of gelatin-AuNPs corresponding to the curve 10.