Figure 2.

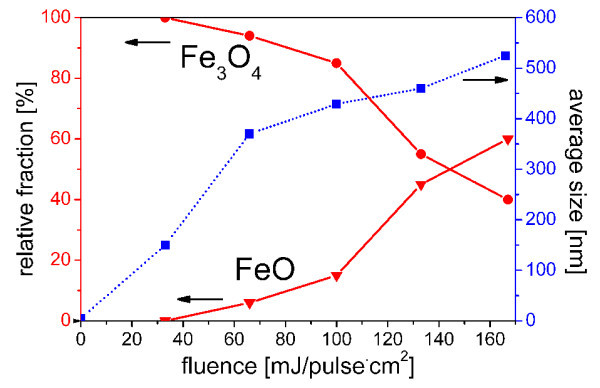
Examination by FE-SEM. Variation of particle size (dotted curve) and relative fraction of Fe3O4 and FeO with fluence (solid line).

Examination by FE-SEM. Variation of particle size (dotted curve) and relative fraction of Fe3O4 and FeO with fluence (solid line).