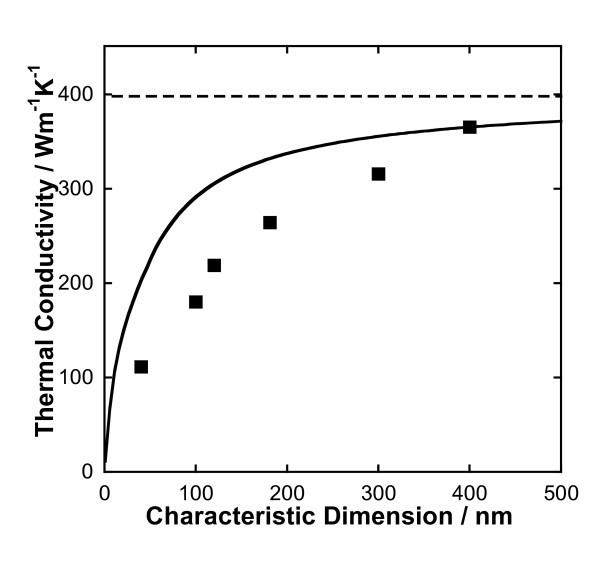
Figure 1.
Size dependent thermal conductivity of copper. The solid line represents the thermal conductivity of copper nanoparticles calculated using Equations 3 and 5. The dashed line represents the bulk thermal conductivity of copper at 298 K. Data points are for copper thin films [18]

