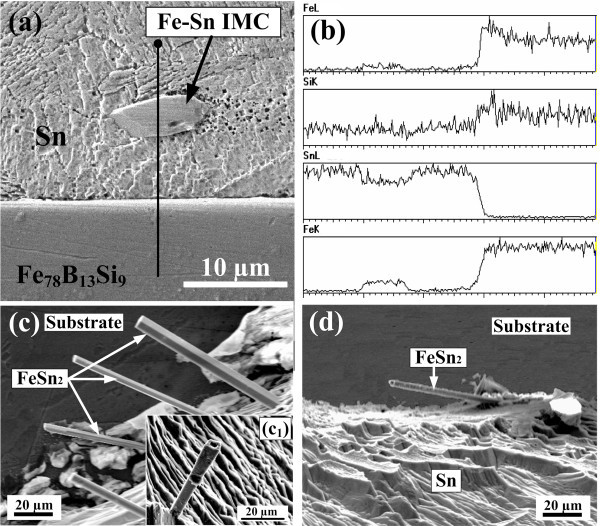
Figure 4.
Interfacial microstructure, compositional variation and morphology of the IMCs: (a) Cross-sectional microstructure for Sn on the Fe78B13Si9 ribbon annealed at 600 K. (b) EDS analysis for the compositional change at the line position labeled in (a). (c, d) Top-view morphologies of the exposed FeSn2 phase grown from the solid-liquid interface into the drop bulk for the substrates annealed at 600 K (c) and 700 K (d), respectively, after partial removal of the solidified Sn drops. The inset in (c) shows the internal hollow structure of the FeSn2 phase.

