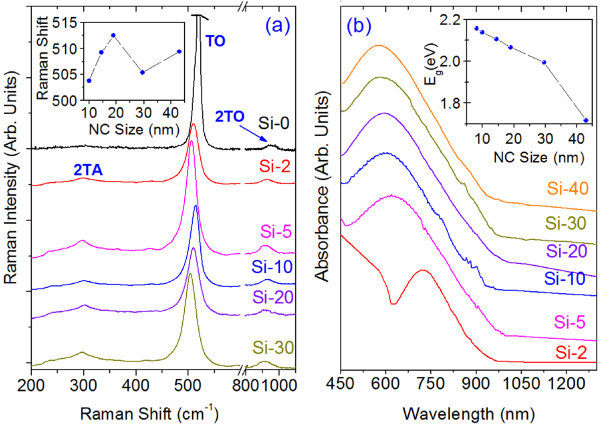
Figure 2.
Micro-Raman and UV-Vis-NIR spectra of the freestanding Si NCs. (a) Micro-Raman spectra of different size Si NCs. Inset shows the plot of Raman shift of TO modes as a function NC size. (b) UV-Vis-NIR absorption spectra of the different size Si-NCs. Inset shows the band gap (Eg) calculated from the absorption spectra as a function of NC size.

