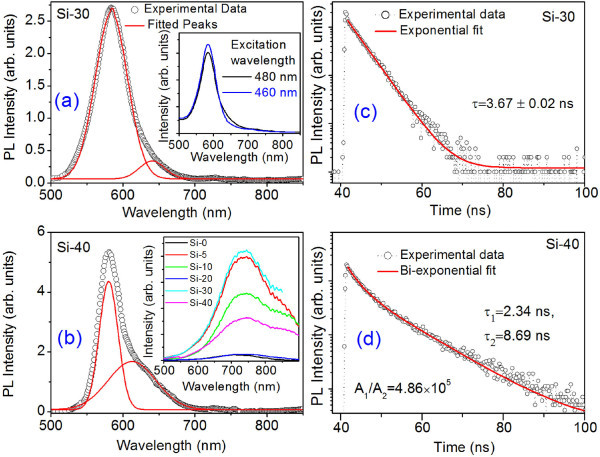
Figure 3.
Steady-state PL and PL decay dynamics spectra of the freestanding Si NCs. (a) Room temperature PL spectra of as-prepared Si-30. Two Gaussian peaks are fitted (solid line) to the experimental data (symbol). Inset shows PL spectra for two different excitation wavelengths. (b) PL spectra for as-prepared Si-40. Fitted peaks are shown with solid line. The inset shows the broad PL spectra of different samples after room temperature prolonged oxidation of the Si-NCs. (c, d) The PL decay dynamics (intensity in logarithmic scale) of Si-NCs for Si-30 and Si-40 at emission wavelengths 585 and 580 nm, respectively. The exponential fits are shown with solid line in each case.

