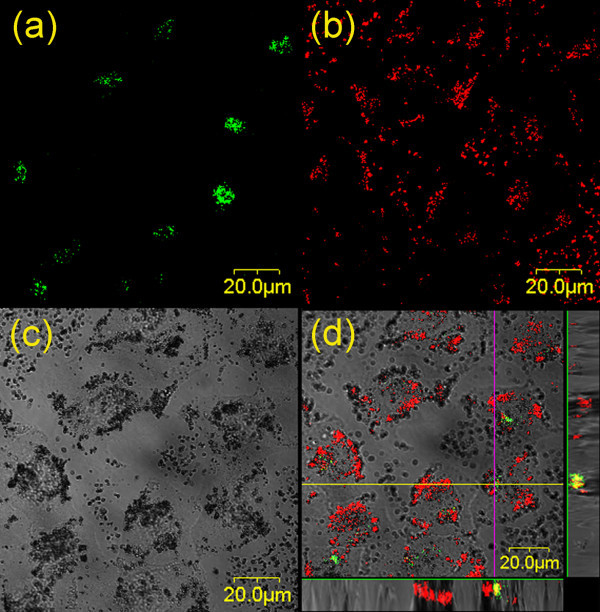
Figure 7.
Micrographs of the distributions of Golgi complexes and TiO2 nanoparticles in HeLa cells. (a) The distribution of Golgi complexes (green), (b) the distribution of TiO2 nanoparticles (red), (c) differential interference contrast (DIC) micrograph, and (d) the merged image of (a), (b), and (c), in which the yellow color denotes the co-localization of TiO2 nanoparticles with Golgi bodies. The images displayed at the bottom and right side of (d) were the X-Z and Y-Z profiles measured along the lines marked in the main image, showing the 3D distributions of TiO2 and Golgi bodies.

