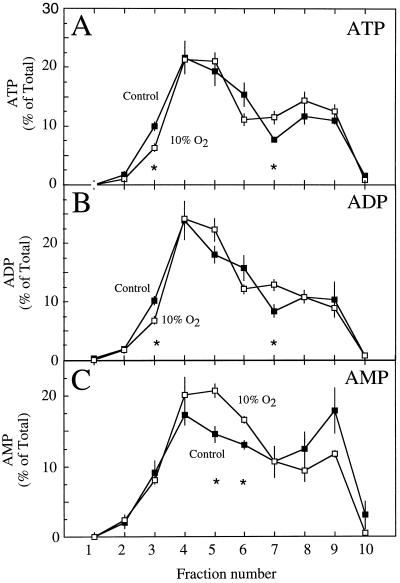
Figure 4.
The proportional distribution of ATP (A), ADP (B), and AMP (C) within the fractions taken from a nonaqeuous gradient of lyophilized particles from soybean nodules of control plants (▪) and from nodules of nodulated roots exposed to 10% O2 for 3 min (□). Values are presented as the mean (±se) of four replicates. Values within a fraction that were significantly different (P = 0.05) between control and treated nodules are marked with asterisks.

