
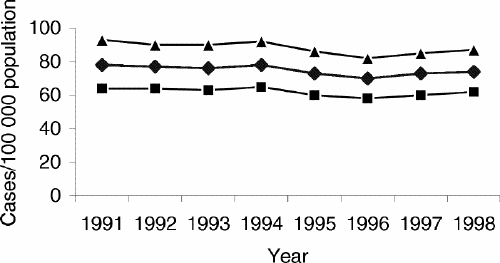
FIG. 1. Trends in acute appendicitis in Ontario per 100 000 population for the fiscal years 1991–1998 by year and sex. Diamonds = age- and sex-adjusted rate, squares = age- adjusted rate in females, triangles = age-adjusted rate in males (applies also to Figs. 2 and 3).