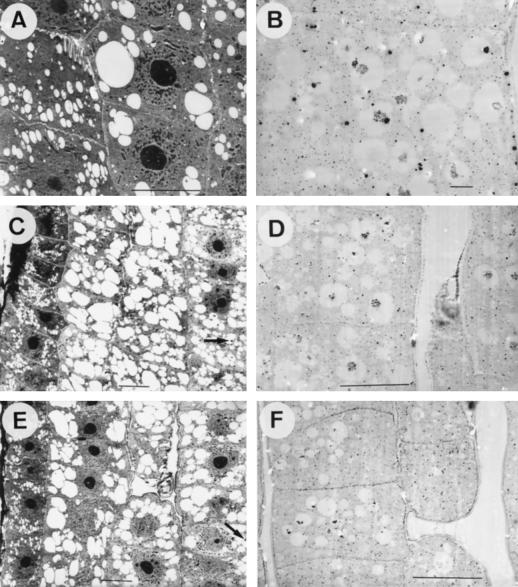
Figure 3.
TEM images from longitudinal sections of root tips of maize plants exposed for 0 (A and B) or 4 h (C–F) to control (0 μm Al) (A–D) or 20 μm Al (E and F) containing nutrient solution. A, C, and E, Glutaraldehyde-fixed samples. B, D, and F, PA-stained samples. Note the abundance of electron-translucent vacuoles with only some peripheric electron-dense deposits (C and E, arrows) in conventionally fixed samples and the abundance of electron-dense precipitates in the central part of vacuoles from PA-stained samples (B, D, and F). All scale bars represent 10 μm, except B, where bar is 1 μm.

