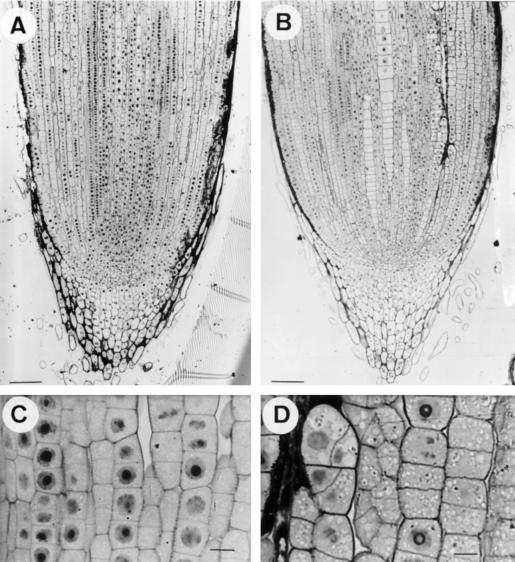
Figure 5.
Light-microscopy images from longitudinal sections (PA stained) of root tips of maize plants exposed for 24 h to control (0 μm Al) (A and C) or 20 μm Al in nutrient solution (B and D). Controls (A and C) show well-organized cortical cell lines with almost horizontal cell-division planes. Al-exposed plants (B and D) exhibit irregular cell-division planes in internal cortical cells. A and B, Scale bars represent 100 μm; C and D, scale bars represent 10 μm.

