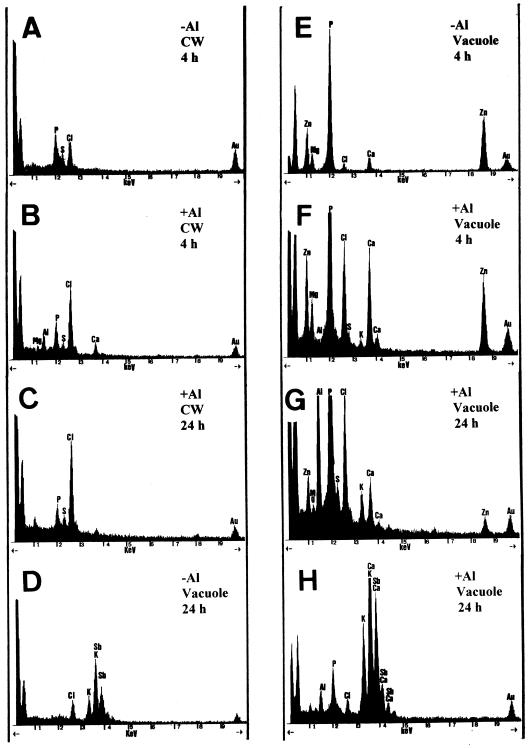
Figure 6.
Representative EDXMA spectra from electron-dense deposits in cell walls (A–C) and vacuoles (D–H) of root-tip (0–1.5 mm) cells after 4-h (A, B, E, and F) and 24-h treatments (C, D, G, and H). A, D, and E are from control plants and B, C, F, G, and H are from Al-treated plants. All spectra are from glutaraldehyde-fixed samples, except D and H, which are from PA-stained samples. All spectra are printed at 1000 counts. Au is from the grid.

