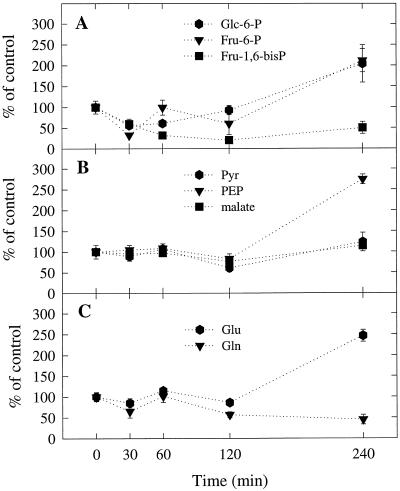
Figure 2.
Effect of detopping on the concentrations of selected metabolites in nodule extracts. Data are the means ± se (n = 3 or 4). Values for the detopped plants are expressed as percentages of the values for the control plants assayed at the corresponding times. Control values did not change significantly over time. The mean values ± se (n = 20) for the control plants averaged across all times were: 1.04 ± 0.07, 0.7 ± 0.06, 0.16 ± 0.01, 0.16 ± 0.01, 0.32 ± 0.02, 13.69 ± 0.5, 16.19 ± 0.9, and 6.11 ± 0.5 μmol g−1 nodule dry weight for Glc-6-P, Fru-6-P, Fru-1,6-bisP, PEP, pyruvate (Pyr), malate, Glu, and Gln, respectively.

