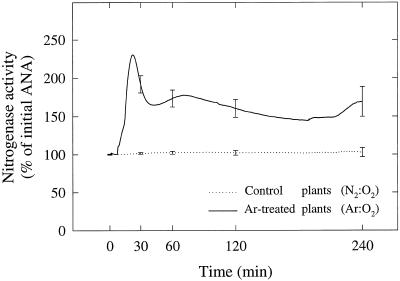
Figure 4.
Time course of H2 evolution rate during continuous exposure of intact nodulated alfalfa roots to N2:O2 (80:20, v/v, control plants) and Ar:O2 (80:20, v/v, treated plants). Data were plotted as percentages of the respective apparent nitrogenase activity (ANA) value obtained at time 0. The control data were obtained from three replicate plants and the data for the treated plants were obtained from five replicate plants. Bars represent se at chosen times. The average apparent nitrogenase activity value for the control plants at time 0 was 13.4 ± 0.8 μmol H2 g−1 nodule dry weight h−1 (n = 8).

