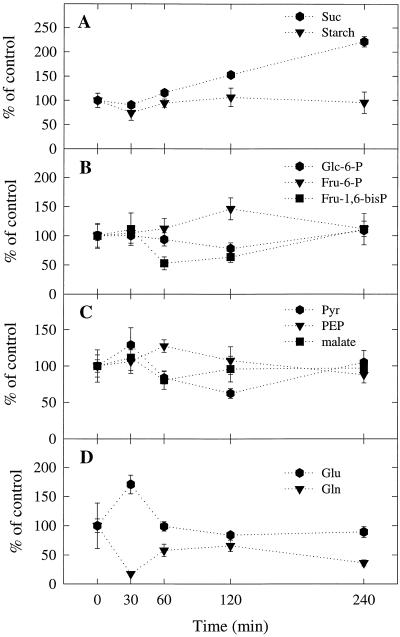
Figure 5.
Effect of Ar:O2 treatment on the concentrations of selected metabolites in nodule extracts. Data are the means ± se (n = 3 or 4). Values for the Ar:O2-treated plants are expressed as percentages of the values for the control plants assayed at the corresponding times. The mean values ± se (n = 17–20) for the control plants averaged across all times were 0.3 ± 0.03 mmol Glc equivalents g−1 nodule dry weight for starch, and 14.36 ± 0.7, 1.19 ± 0.05, 0.48 ± 0.03, 0.13 ± 0.01, 0.27 ± 0.02, 0.42 ± 0.03, 12.86 ± 0.6, 20.20 ± 1.02, and 2.85 ± 0.34 μmol g−1 nodule dry weight for Suc, Glc-6-P, Fru-6-P, Fru-1,6-bisP, PEP, pyruvate (Pyr), malate, Glu, and Gln, respectively.

