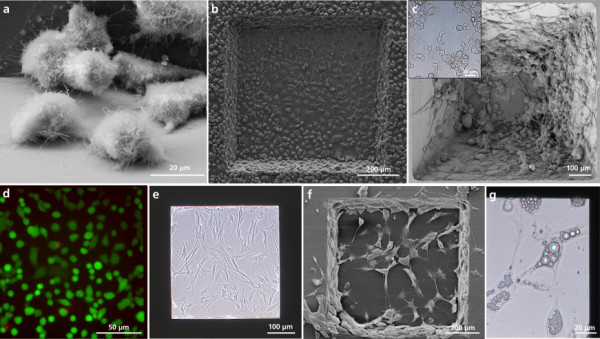
Figure 3.

Microscopic images of different cell types cultured in the miniaturized cell culture chamber. (a) Scanning electron microscopic image of A549 cells on the Si-sidewalls. Scale bar 20 μm. (b) Scanning electron microscopic image of A549 cells after 7 days of culture on the Si3N4 membrane. Scale bar 200 μm. (c) Scanning electron microscopic image of PC-12 cells 8 days after neuronal differentiation. Scale bar 100 μm. Small box: bright-field image of neuronal differentiated PC-12 cells. Scale bar 50 μm. (d) Fluorescence microscopic image of A549 cells after 7 days of cultivation after FDA/PI staining. Scale bar 50 μm. (e) Bright-field microscopic image of proliferating hMSCs after 7 days. Scale bar 100 μm. (f) Scanning electron microscopic image of hMSCs after 18 days adipogenic differentiation. Scale bar 100 μm. (g) Bright-field image of adipogenic differentiated hMSCs. Scale bar 20 μm.
