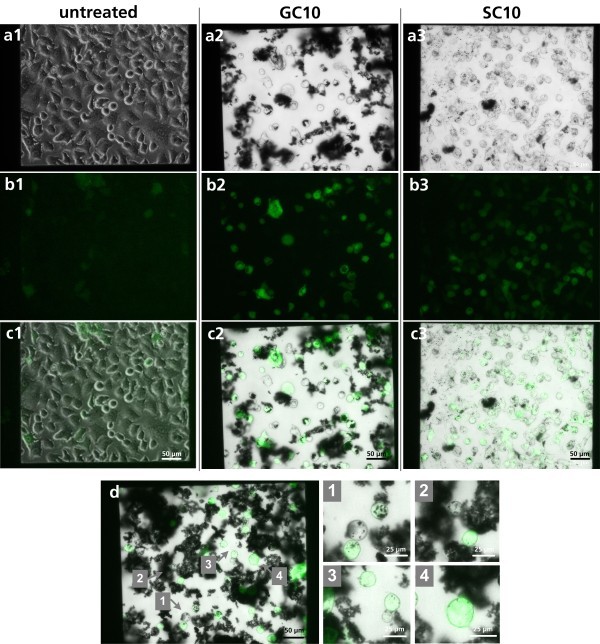
Figure 5.
Microscopic images of SC10- and GC10-treated pIL8-GFP A549 cells in the microcavity. pIL8-GFP A549 cells were treated for 48 h with (2) GC10 and (3) SC10 under physiological conditions. (a) Bright-field image. Scale bar 50 μm. (b) Fluorescence image. Scale bar 50 μm. (c) Overlay of the bright-field and the fluorescence images. Scale bar 50 μm. (d) Overlay of the bright-field and the fluorescence images of individual GC10-exposed pIL8-GFP A549 cells. Sections of this image are pictured in (d1 to d4). Beside individual GFP-expressing pIL8-GFP A549 cells interacting with nanoparticle aggregates (d1, d2), also GFP-expressing cells with few or less nanoparticle interaction were observed (d3, d4).

