Figure 7.
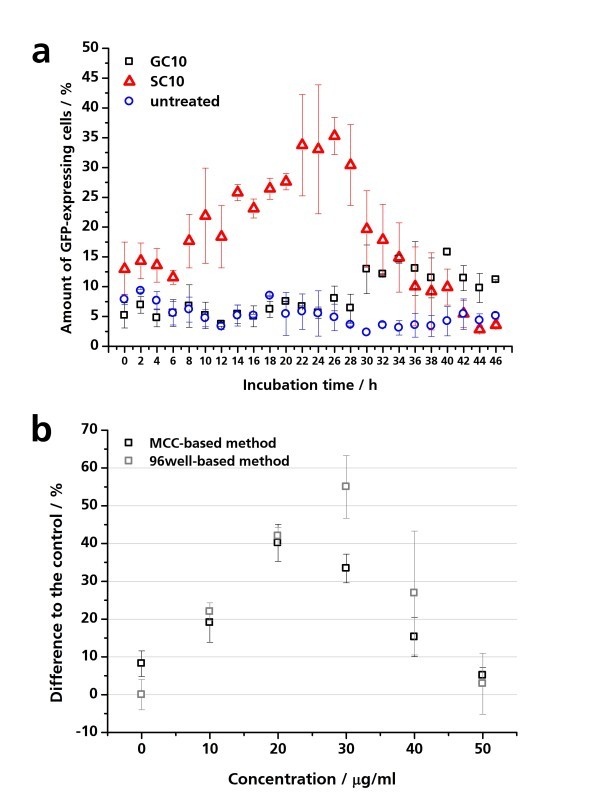
Concentration- and time-dependent effects of nanoparticles on the GFP expression of pIL8-GFP A549 cells. (a) pIL8-GFP A549 cells were cultured in the microcavities and exposed to 30 μg/ml GC10 and SC10 for 48 h. The GFP expression of the pIL8-GFP A549 cells was analyzed via fluorescence time-lapse microscopy. The percentage of GFP-expressing cells was quantified using the software analysis. (b) pIL8-GFP A549 cells were treated with 0 to 50 μg/ml SC10 for 24 h in the microcavity under physiological conditions. Parallel 10,000 pIL8-GFP A549 cells were cultured and treated in a 96-well microplate with 0 to 50 μg/ml SC10. The GFP expression of the pIL8-GFP A549 cells in the microcavities was analyzed by fluorescence microscopy and the GFP expression of the cells in the microplate by fluorescence spectrometry.

