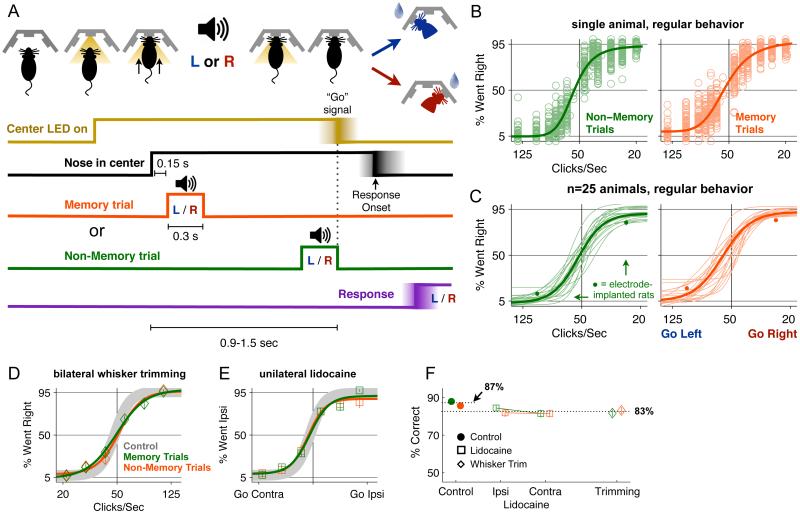
Figure 1. Memory-guided Frequency Discrimination Task and Behavioral Performance.
(A) Task schematic, showing a cartoon of a rat in the behavior box and the timing of the events in the task. Onset of the Center LED indicated to the rat it should put its nose in the center port, and remain there until the LED was turned off. During this variable-duration “nose fixation” or “nose-in-center” period, a 300 ms-long periodic train of auditory clicks was played. Click rates higher than 50 clicks/sec indicated that a water reward would be available from the left port; click rates lower than 50 clicks/sec indicated reward would be available from the right port. On memory trials (orange), the click train was played near the beginning of the fixation period, and there was a several hundred ms delay between the end of the click train and the end of the nose fixation signal. On non-memory trials (green) the click train ended at the same time as the nose fixation signal. (B) An example of performance data for a single rat. Each circle indicates the percentage of trials in which the subject chose the right port for a given stimulus in a single session. There were 6 stimuli presented in each session. The thick line shows the psychometric curve, drawn as a 4-parameter sigmoidal fit to the circles. The left panel shows data from non-memory trials, and the right panel shows data from memory trials. (C) Psychometric curves showing performance of 20 rats. Thin lines are the fits to individual rats, as in panel B. Thick lines are the fits to the data combined across rats. The performance of electrode implanted rats (n=5) is shown by the small filled circles at the two stimuli used with these animals (25 clicks/sec and 100 clicks/sec). (D) Bilateral whisker trimming (3 rats) has a minimal effect on performance. The grey line is the average of memory and non-memory trials for control sessions before whisker trimming. Diamonds are data after trimming, solid lines are sigmoid fits. Memory trials are in orange, non-memory trials in green. (E) Unilateral whisker pad anesthesia and paralysis (4 rats) also has a minimal effect on performance. Open circles are data from lidocaine sessions. Color conventions as in panel D. (F) Summary of effects of whisker trimming and lidocaine (See also Figure S1, Movies S1-3).

