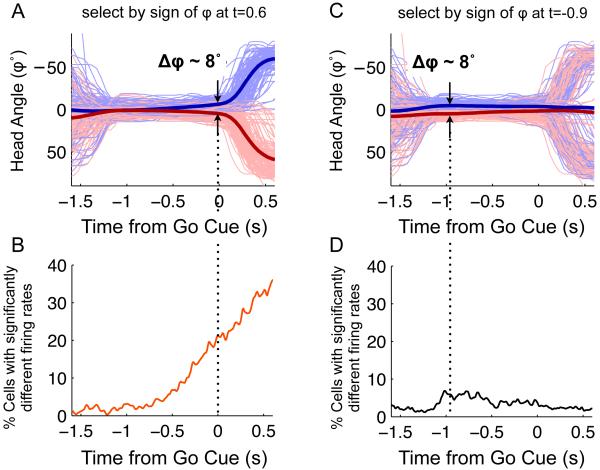
Figure 7. Predictive coding of response is not a simple function of current head angle.
A, C Plots of head angle as a function of time relative to the Go signal for memory trials. Thin blue lines are from a random subsample of trials where the head angle was greater that 0 (oriented leftwards from center port) at the time indicted by the vertical dotted line; thin red lines are from a random subsample of trials where the head angle was less than 0 at the indicated time: t=+0.6 sec for A and t=−0.9 sec for C, relative to the Go signal. Thick lines are the mean head angles for each group, averaged over all correct memory trials. B, ROC plot (similar to 5b) for the trial grouping defined in A. D, ROC plot for the trial grouping defined in C. (See Figure S7 for similar analyses using angular velocity and acceleration).

