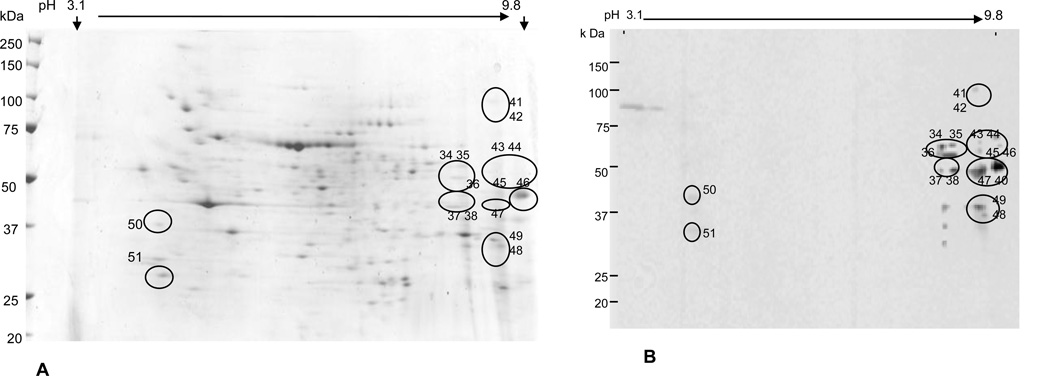
Fig. 1.
2D gel profile of splenic proteins of a control rat (CBB G250 stained; Fig. 1A). The protein spots for nitrated proteins, identified by Western blot, are shown in black circles (Fig. 1B), and were also matched to the 2D gel protein profile (Fig.1A). The numbers used for the spots are the same as in Tables 2 and 3.

