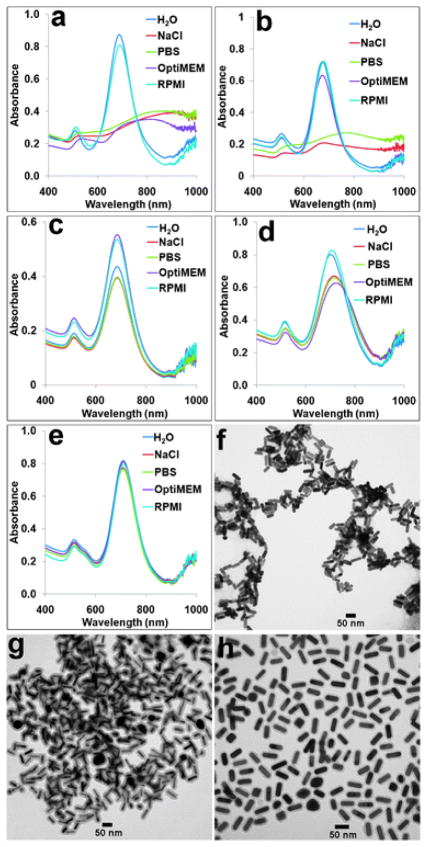
Fig. 3.
Spectral and TEM measurements of the colloidal stabilities of GNRs with various surface chemistries. (a–e) Vis-NIR spectra of GNR@CTAB, GNR@PSS, GNR@SH–PEG, GNR@SiO2, and GNR@SiO2@PE-PEG dispersed in water, PBS buffer, 100 mM NaCl solution, OptiMEM, and RPMI cell culture medium. Agglomeration can be detected based on the spectral shift of GNRs’ longitudinal bands. (f–h) Representative TEM images of GNR@CTAB, GNR@SiO2, and GNR@SiO2@PE-PEG dispersed in 100 mM NaCl. This comparison clearly shows that GNR@CTAB and GNR@SiO2 are clustered but GNR@SiO2@PE-PEG remain single.

