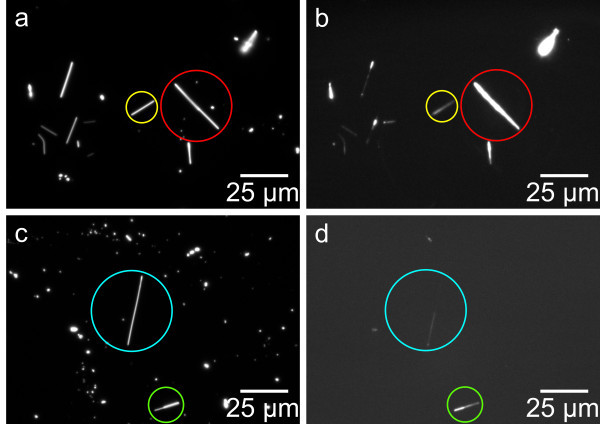
Figure 2.
Dark field (a and c) and fluorescence (b and d) images of biofunctionalized ZnO nanowires. Nanowires in upper row have been modified with Cy3-marked DNA and nanowires in bottom row with FITC-marked DNA. Note that the nanowires marked with the red and yellow circles in (b) show different fluorescence intensities. The nanowire marked blue in (d) only shows fluorescence at one side; the nanowire marked green shows higher fluorescence intensity at the side that is appearing darker in the corresponding dark field image.

