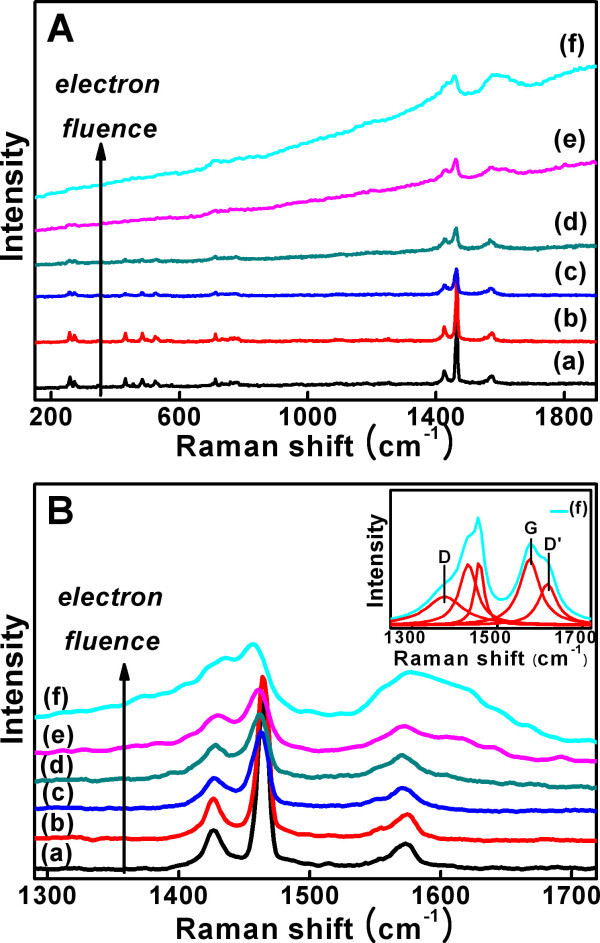
Figure 5.
Raman spectra. (A) Raman spectra of electron-irradiated PCBM at different electron fluences of (a) 0, (b) 3.6 × 1016 cm-2, (c) 7.2 × 1016 cm-2, and (d) 1.44 × 1017 cm-2, (e) 2.88 × 1017 cm-2, and (f) 3.96 × 1017 cm-2. (B) Raman spectra of 1,300- to approximately 1,700-cm-1 region with the subtraction of the linear Raman scattering background for peak analysis. The upper right inset shows the deconvoluting peaks in the 1,300- to approximately 1,700-cm-1 spectra region of (f) in (B).

