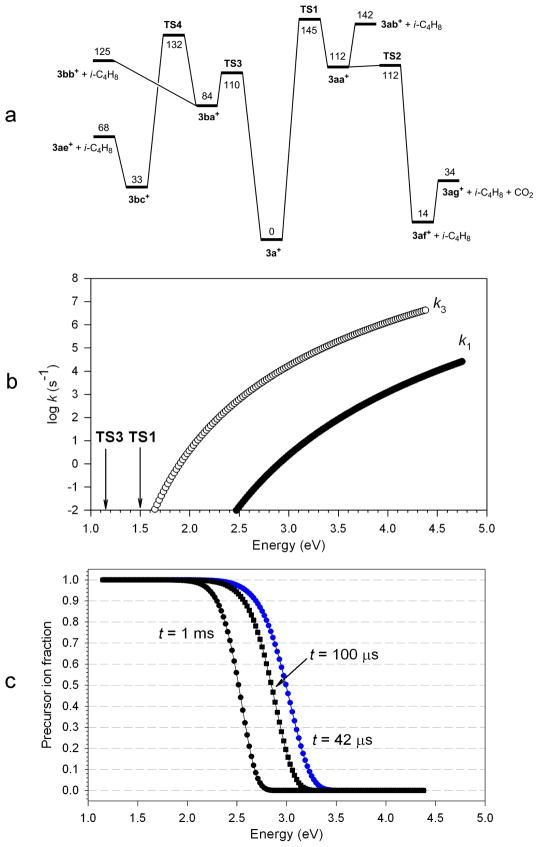
Figure 7.
(a) B3-MP2/6-311++G(2d,p) potential energy surface for dissociations of 3a+ and (b,c) RRKM kinetics of elimination of i-C4H8. (b) Rate constants for elimination through TS1 (k1) and TS3 (k3); (c) Calculated fractions of non-dissociating 3a+ at the indicated reaction times: Black circles: 1 ms; black squares: 100 μs; blue circles: 42 μs.

