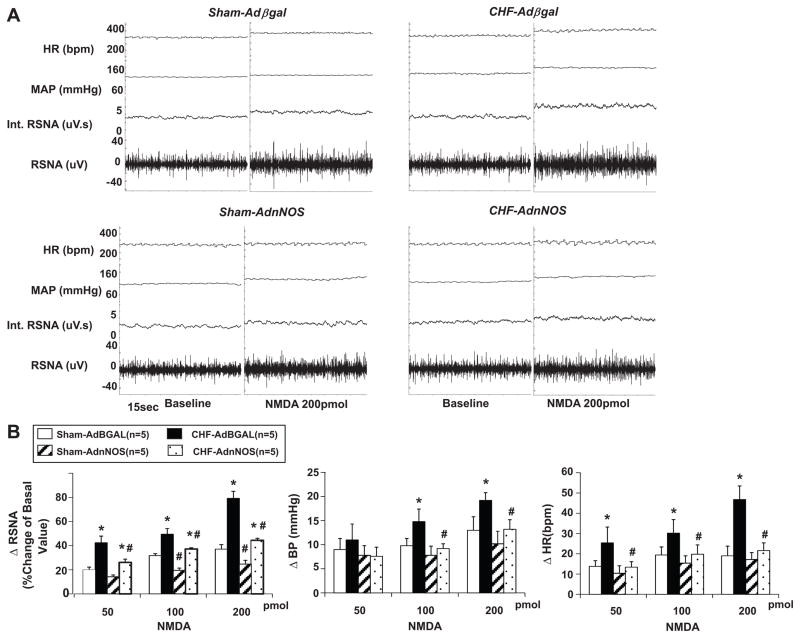
Figure 4.
A. Segments of original recordings from individual rats from each experimental group showing response to RSNA, integral of RSNA (int. RSNA), MAP and HR to the microinjections of NMDA (200pmol) into the PVN. B. The mean data of changes in RSNA, MAP and HR after microinjections of NMDA into the PVN in four experimental groups of rats. *P<0.05 versus group of sham. #P<0.05 versus AdβGal injected group.

