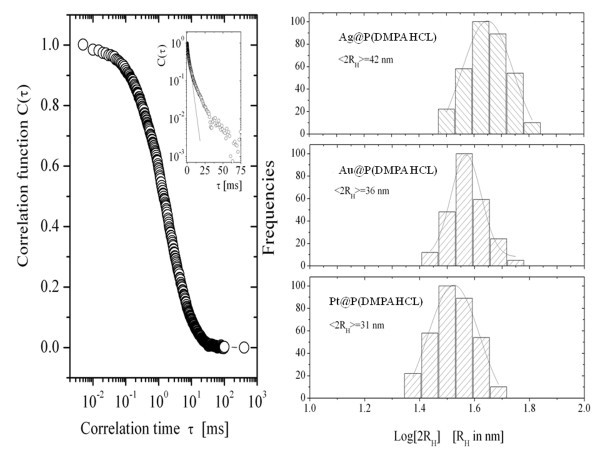
Figure 5.
DLS measurements.Left: A typical correlation function C(τ) as a function of the correlation time τ for Ag(DMPAHCl) in aqueous solution. The inset shows the correlation function in a log scale, evidencing deviations, at longer times, from a single relaxation process characterized by a single decay time. Right: The histograms of the distribution of the hydrodynamic radius of the nanoparticles in aqueous solutions. Upper panel: Ag@P(DMPAHCl) with an average hydrodynamic radius of 21 ± 2 nm; intermediate panel: Au@P(DMPAHCl), with an average hydrodynamic radius of 18 ± 2 nm; bottom panel: Pt@P(DMPAHCl), with an average hydrodynamic radius of 15.5 ± 0.5 nm.

