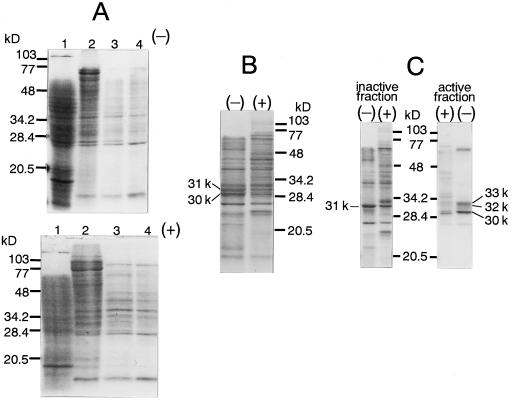
Figure 3.
Comparison of NAS purification from Fe-deficient (−) and Fe-sufficient (control, +) barley roots. SDS-PAGE was carried out using 12.5% acrylamide slab gels (Laemmli, 1970). Gels were stained with Coomassie brilliant blue. A, top, From Fe-deficient barley roots; bottom, from control barley roots. Lanes 1, Crude extract, 200 μg of protein. Lanes 2, After Butyl Toyopearl 650M, 100 μg of protein. Lanes 3, After hydroxyapatite, 20 μg of protein. Lanes 4, After Butyl Toyopearl 650M, 15 μg of protein. B, After DEAE-Sepharose fast flow, 25 μg of protein. C, After Ether Toyopearl 650M, one-quarter of each fraction.

