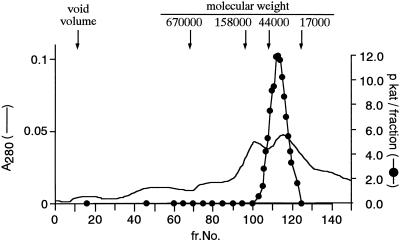
Figure 5.
Elution pattern of NAS activity from the gel-filtration column. The black circles indicate NAS activity. The solid line indicates protein concentration monitored at 280 nm. The active NAS fraction after hydroxyapatite chromatography was applied to a Sephacryl S300HR column (1.5 × 71 cm, 125 mL). The column was calibrated with standard proteins: thyroglobulin (Mr 670,000), γ-globulin (Mr 158,000), ovalbumin (Mr 44,000), and myoglobin (Mr 17,000). The linear flow was 10 cm h−1.

