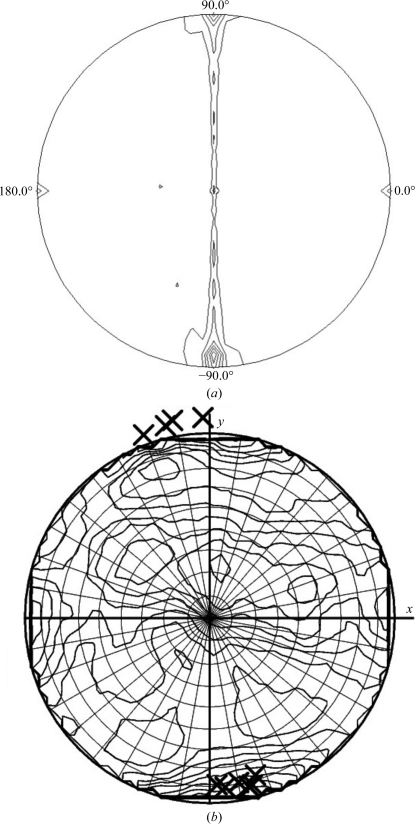
Figure 3.
(a) A stereographic projection of the κ = 180° section of the self-rotation function obtained with the program POLARFFN in the CCP4 package. In the plot, ω varies from 0 to 90° in the radial direction, while ϕ varies from 0 to 360° as measured in an anticlockwise direction from the a axis. The a axis points to the right in the plane of the paper, while the c* × a axis points up in the plane of the paper. Data between resolution limits of 9 and 4.0 Å were used in the calculation. A Patterson integration radius of 60 Å was also used in the calculation. (b) A plot from the program DIBER showing the top ten solutions of the Phaser rotation function (marked ×) on top of the local intensity averages in the thin 3.4 Å resolution shell on a stereographic net.

