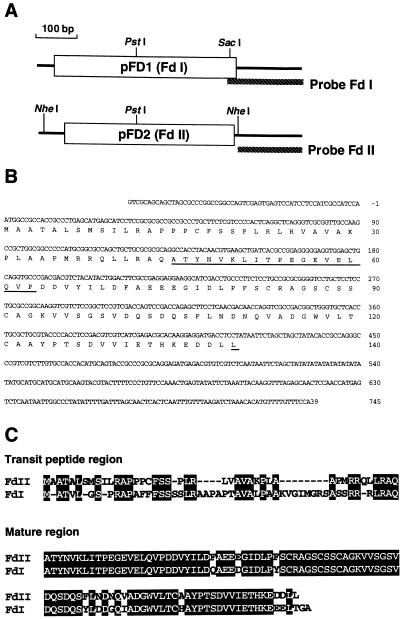
Figure 1.
Restriction map of maize Fd cDNAs (A), nucleotide sequence of the cDNA designated pFD2 (B), and comparison of the deduced amino acid sequences of maize Fd I and Fd II (C). A, The coding region is represented by an open box. Positions of the gene-specific probes that were used for RNA analysis are indicated by hatched bars. B, The amino acid sequence encoded by the open reading frame is shown below the nucleotide sequence. The determined N-terminal amino acid sequence and C-terminal residue of the mature form of Fd II (Hase et al., 1991a) are underlined. C, The amino acid sequence of maize Fd II deduced from pFD2 is compared with that of maize Fd I (Hase et al., 1991a). Gaps, denoted by dashes, have been inserted to achieve maximum homology. Identical amino acid residues between Fd I and Fd II are indicated by white letters on a black background.

