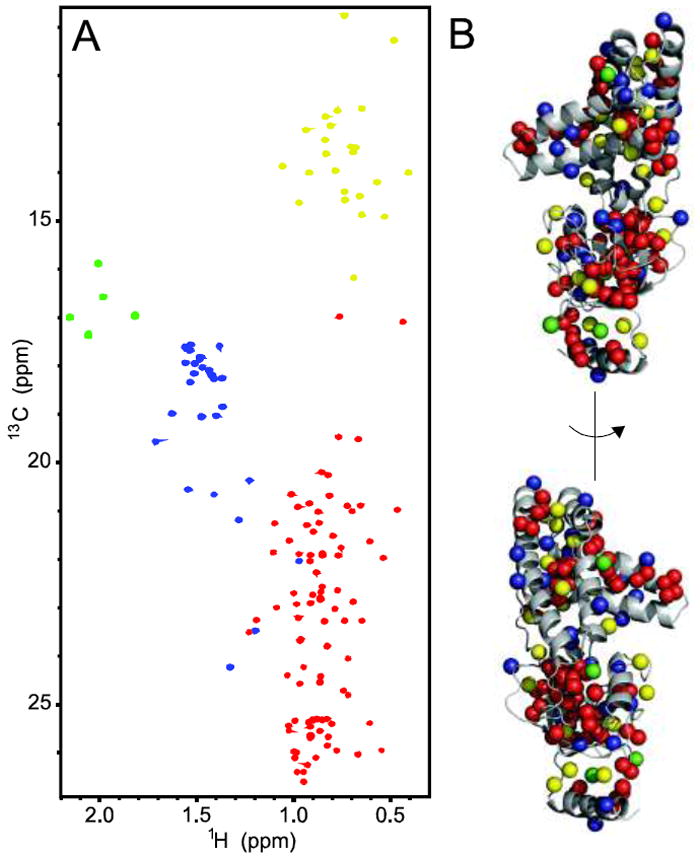
Fig. 3.

a 1H–13C HMQC spectrum of U-[2H,12C], Ala-[13CH3], Ile-δ1-[13CH3], Met-[13CH3], Val-Leu-[13CH3, 12CD3] EIN. b Two views of the 3D structure of EIN with methyl groups displayed as spheres. The color coding of the methyl groups used in both panels is as follows: Ala blue; Ile yellow; Met green; Leu/Val red. Classification of the methyl cross-peaks based on residue type was obtained by running methyl-TROSY experiments on samples D–G (Table 1)
