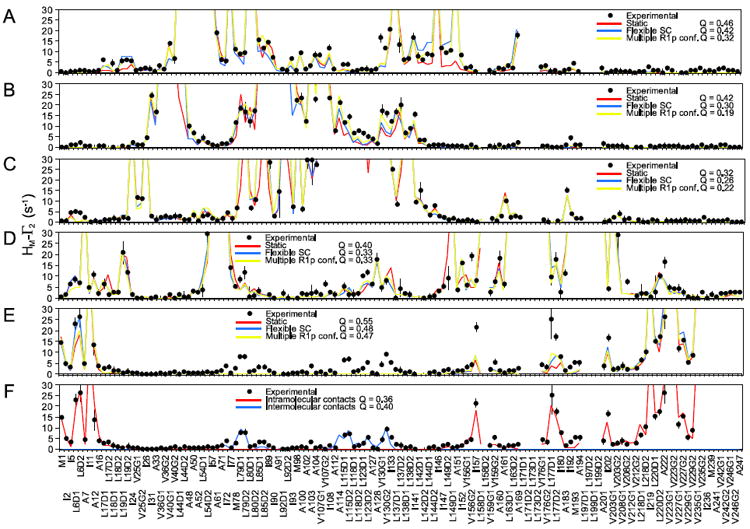
Fig. 4.

Fitting the experimental PRE data for the a A52C, b Q87C, c S113C, d S196C, and e A241C spin-labeled mutants of EIN. The experimental PRE profiles are displayed as closed black circles (with error bars equal to 1 standard deviation). PREs too large (>30 s−1) to be accurately measured are plotted at the top of the charts. PRE profiles back-calculated from the structure of EIN are shown as solid lines: red, side chains fixed during the fitting; blue, side chains allowed to move; yellow, side chains allowed to move and R1p treated as a three-conformer ensemble. For every fit the corresponding PRE Q-factor is also reported. f Fitting of the experimental PRE data for the A241C mutant that accounts for the effect of transient intra- and inter-molecular interactions (see “Materials and methods”). A listing of the experimental PRE rates is provided in Supplementary Table S2
