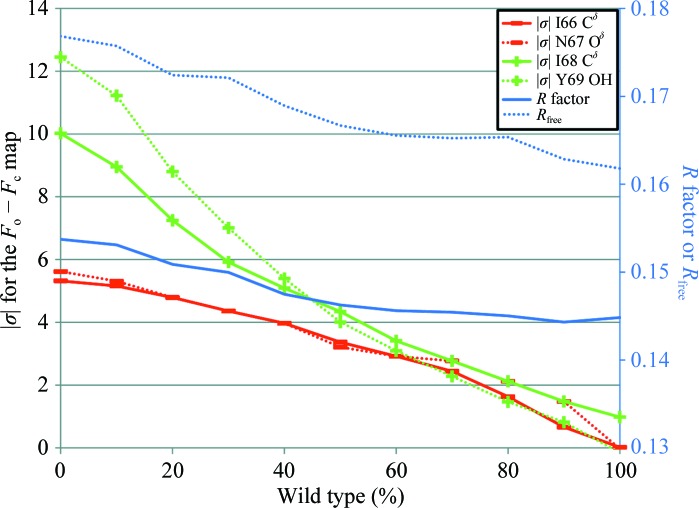
Figure 2.
Change in magnitude of map σ and R factor with increasing wild-type character. The map σ value is evaluated at the position of one atom per residue that is unique to either the wild-type or the variant protomers. The map σs (left axis) that are positive are shown in green and denoted with a + sign, while the map σs that are negative are shown in red with a − sign. R factors (right axis) are shown in blue.

